Visualizing the principal components
We use principal component analysis (PCA) to extract components and attempt visualizing the data.
Visualizing multi-dimensional data
Visualizing multi-dimensional data is difficult even when the number of samples in the data set is reduced. The (reduced) attack dataset (1) still contains almost all of the features in the original (raw) data set.
Using PCA to reduce dimensions
We use Scikit-learn’s PCA module to extract a handful (six) of principal components from the data (2). Our hope is that plotting labels against a few pairs of principal components might reveal some pattern that improves our understanding of the data.
Of course, PCA transforms the original features making interpretation of the axes in plots more difficult. Regardless an experiment appears worth the effort.
Interpreting pair-wise plots
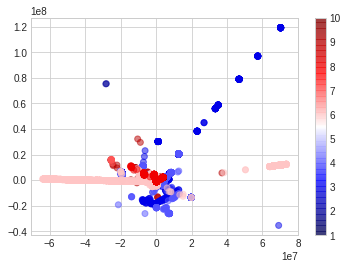
We plot the labeled data against the first six principal components.
The first chart below has the first principal component on the x-axis and the second principal component on the y-axis. The label is mapped to a color. The second and third charts are similar but apply to principal components three, four and five, six respectively,
We see that while there is some pattern to the data, plotting the labels against first six components, two at a time, is not enough to demonstrate the margin boundary between the various attack classes.
Principal components one, two
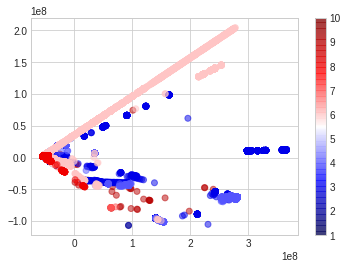
Principal components three, four
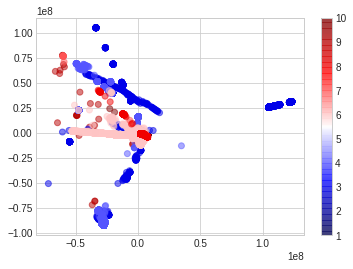
Principal components five, six