ROC curve comparison of models
Given that the models’ performance is similar for F1 scores, we draw some Receiver Operating Characteristic (ROC) curves to understand these models’ performance at low false-positive rates.
ROC curves are explained in 1. These curves are useful to understand classification performance across a range of false-positive rates.
2 takes the predicted probabilities of a job description being fraudulent (in the test set) and extracts a ROC curve from them. Four models are plotted: BOW + FCNN (3), LSTM with inline embedding (4), Transformer with position embedding (5), and BOW + Logistic Regression (6). The results are in the figure below:
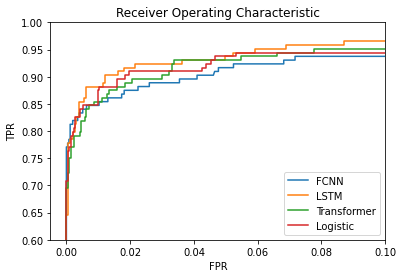
We observe that:
- even at low false-positive rates, the performance of the four models remains close
- the LSTM model does slightly better than the other three models at most (low) false-positive rate thresholds
- the Logistic regression model does quite nicely despite its simplicity